Stocks and bonds don’t correlate—except when they do. One of the frustrating things about laws of finance is that they tend to break. A lot. Some laws are more solid than others, like the principle of the time value of money or the inverse relationship between bond prices and yields. Others tend to break more often, like the inverse returns of stocks and bonds.
The idea, generally, is this: there is a set amount of money at any given time, and the amount that is dedicated to investment vehicles stays roughly constant. Investors can choose between risk (stocks) and low-risk (bonds) at their will. In times of greed, they choose stocks. In times of fear, they choose bonds. As a result, people will often sell one to buy another, causing the price of one to go down when the other goes up.
The sounds like a great pair-trade opportunity, and it has historically been seen as one. In fact, the portfolio allocation advice most financial professionals give is based on this very principal (ironically feeding the principal and making it even truer).
Since 2008, however, the validity of this principal has been severely tested, especially in the United States. This is because of two things. Firstly, there is a new buyer in the market: the Federal Reserve, who has been using bond buying programs to inject capital into the market. Secondly, there has been the “secular stagnation” of Larry Summers, who posits that we are entering a new era of slow economic growth. Both of these trends ultimately change the relationship between U.S. Treasuries and U.S. stocks, meaning they are no longer correlated.
Looking at a 10-year chart of the S&P 500 (SPY) and the iShares 20+ Year Treasury Bond ETF (TLT) makes this point very clear.
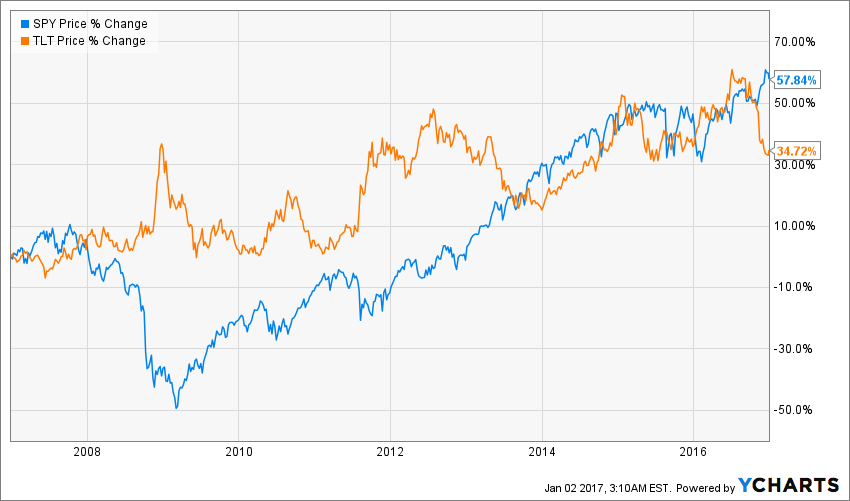
Note how SPY fell as TLT rose in 2009—and how they seemed to go in different directions for most of the time up until that point. This is the “normal” trend for equities and bonds.
But notice from the end of 2009 onward, we see much less inverse correlation between the two. In fact, for much of 2010, they are very correlated. From 2014 onward, the positive correlation is shockingly close. It seems as if the traditional relationship has not just broken down, but reversed.
Let’s zoom in on 2016, because we’ll see something very interesting:
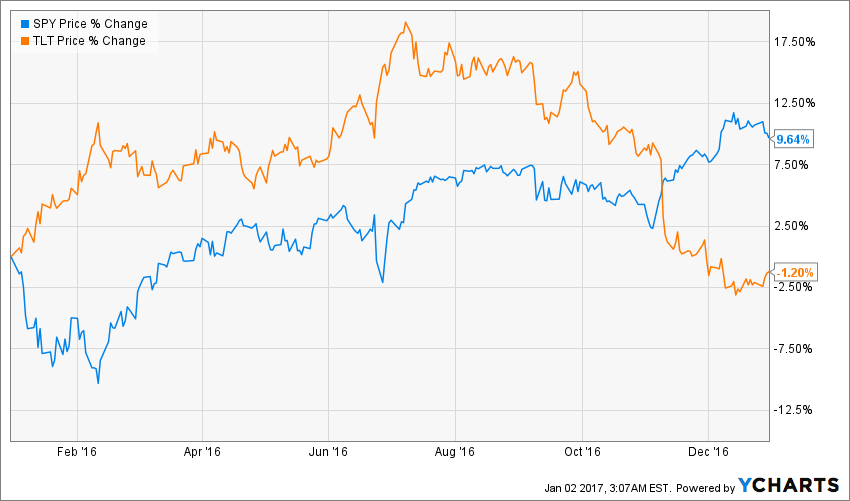
The inverse correlation seems to have come back in November, right when President-elect Trump won. This is the starkest inverse relationship between these two in years—almost as if the market is expecting the pre-2008 world to return.
This is an interesting observation, and it demands further study. Why does the market think this? Have new trends indicated stocks and bonds will no longer trade together, but will trade in opposite directions? Is this a reflection of changes in the Federal Reserve’s monetary policy? Is it a reflection of changes to fiscal policy? Of expected changes in investor activity?
These are the initial questions we should be asking in a much deeper probe into these two very simple but fundamental asset classes. Understanding their new, changed relationship could possible provide a new approach to financial markets and a new, winning strategy.