You’re probably very familiar with the price-to-earnings ratio, or PE (P/E) ratio as it’s commonly called. It’s a very simple metric that takes the current market price of a stock, the earnings per share on a trailing 12 month basis (or estimated earnings for the next 12 months if you want what’s called the “forward P/E ratio”), and you divide the price by the EPS number. For instance, AT&T reported $2.04 in earnings over the last year and its market price is $38.73, so we get a P/E of 18.94.
You can do this with just one stock or an entire index. By adding up the prices of the S&P 500 and the EPS of the S&P 500 companies, we get the index’s P/E ratio. This sounds simple but it’s actually prone to error and disagreement; several research firms use different methodologies to calculate the EPS of different firms (including whether to use GAAP or non-GAAP numbers, for instance), so you will find different numbers for the index’s P/E ratio. According to the Wall Street Journal, the P/E ratio of the index is about 24, but popular site multpl.com says it’s actually 25.7. So take each number with a grain of salt.
Also take the P/E ratio itself with a grain of salt. There is no correlation between higher or lower P/E ratios and stock returns. P/E ratio norms vary widely from industry to industry. Tobacco firms, for example, tend to have very low P/E ratios, while technology firms tend to have very high P/E ratios. In 2012 and 2013 people derided Facebook (FB) investors for buying the stock despite its 100+ P/E ratio; take a look at a stock chart to see just how wrong that criticism was.
Similarly, betting on low P/E ratio firms with the expectation that the number is too low doesn’t always work. In some cases, the P/E ratio is low because not only is growth low, but growth is going down and, eventually, the firm will bankrupt or get stuck in a quagmire of low earnings. So the P/E ratio itself isn’t the only metric to use.
Not only that, but betting on the P/E ratio.
To understand why, let’s go back to AT&T. If we look at the last 10 years of this company’s P/E ratio and stock performance, we see something very interesting. The P/E ratio has been low with two brief exceptional periods, both of which began with a sudden run up of the stock.
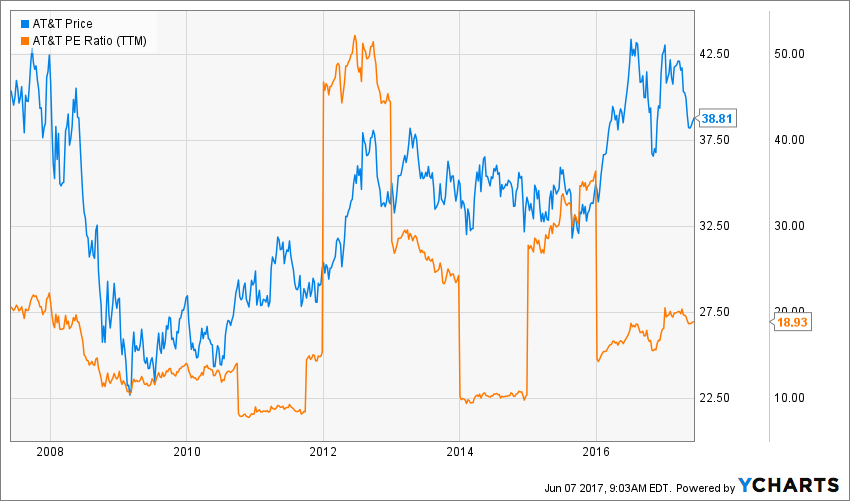
Both in early 2012 and late 2015, the stock’s P/E ratio jumped from less than 20 to over 30 and beyond, reaching over 50 in the 2012 case. Partly this was due to structural troubles at the company in 2015 and expectations of new revenue from Dish in 2015, and interestingly we see the stock reach a new price level each time. Thus betting on AT&T when the P/E ratio went really high was actually a good bet.
Of course, there’s no guarantee of this, but it does tell us something about the efficiency of the markets. Remember that high P/E ratios mean the market is expecting very high growth. When the market is proven right that that high growth actually exists, it becomes reflected in the stock price only AFTER the P/E ratio has spiked. That is a brief arbitrage opportunity that investors can take advantage of.
Does it always work? Of course not. But it does demonstrate that investors need to keep in mind not only the past performance of a stock’s earnings but also the market’s perception of its future earnings potential to accurately value a company’s future growth potential. In other words, you as a financial professional are not just modeling future growth of a company’s earnings but the market’s perception of a company’s future earnings. Sounds hard? It is. Extremely.